Documenting my attempt to cut my energy usage in half.

Monday, August 13, 2012

Refrigerator Analysis Part #2


While collecting data on my current refrigerator to determine if it makes sense for me to replace it, I placed a data collector inside the refrigerator to monitor how the temperature changes throughout the day and also to see when and how long the refrigerator door is open. 

The data logger was an Arduino Uno with an Adafruit Data Logging Shield, a DS18B20 temperature sensor and a photo resistor to detect when the door was open/shut.

Below is a 24 hour graph detailing the temperature swings and the frequency at which they occur.  I was quite surprised by how often the refrigerator cycles on and off.  I assume that the temperature spike at 11pm was due to the freezer going through its defrost cycle.

Refrigerator Temps

Also included in the graph (in red) is when the refrigerator door was opened and for how many seconds within that one minute period that the door was open.  It’s interesting to see the effect that opening the door has on the temperature.

Has anyone else ever put a temperature logger in their refrigerator?  And if so, is my temperature cycle normal?

Refrigerator Analysis


Our current refrigerator is a GE Profile 24.7 ft^3, model number TBX25PAB that was manufactured in March of 2001.  As part of our Half Project, I was interested is seeing how our refrigerator (which is not Energy Star rated) compared to a newer model refrigerator and to see if it made sense to upgrade.

The power consumption of the current refrigerator was measured with a Kill-A-Watt meter over the course of several weeks at 2.4 kWh/day, or 876 kWh/year.  For our area, Dominion Power charges us approximately $0.11/kWh, so our cost to run the refrigerator is $96/year which is about 3% of our yearly energy consumption.

The Energy Star website has a refrigerator/freezer calculator that you can use to calculate the operating costs of your current appliance.  I used this to compare the actual usage data that I collected with the estimated usage from Energy Star.  The chart below shows that the estimated usage is slightly higher than my actual usage, but it is within 10% which is acceptable for an estimate.

Model Data kWh $/kWh

Per year cost

GE TBX25

Actual 876 0.11 $96

GE TBX25

Estimated 961 0.11 $106


GE makes a newer version of the Profile series which is a direct replacement for what I currently have.  It is a little pricey at $1800 but let’s look at its performance.  First of all I’ll ignore the fact that the Sears website has conflicting data with the Energy Star label over yearly kWh usage and I’ll just use the data from the Energy Star label. 

Model Data kWh $/kWh

Per year cost

GE PTS25

Estimated 560 0.11 $61

Using the Energy Star estimates for both the old and new refrigerator I can expect to get the following savings.

Energy Saving/year 401 kWh
$’s Saved/year $44.11
Initial Cost $1800
1st year Return < 2.5%
CO2 Reduction 441 lbs

With a payback period of ~40 years, upgrading to the newer model GE Profile just doesn’t make sense right now.  It’s time to research other models of refrigerators.

Tuesday, February 14, 2012

Solar Site Survey And Collector Output Comparison


I recently conducted a solar site survey for the area by my shop where my solar air heaters are located.  This should normally be done before you build and mount your collector, but in my case, I had never heard of a solar site survey before I built my first collector.

The purpose of the solar site survey is to determine where obstacles are that will block the sun from reaching your collector and to determine if those obstacles will interfere with your collector all year or just certain times of the year.

To do a solar site survey you will need a few simple things…

  • You’ll need to know which direction solar south is
  • A sun chart
  • An elevation and azimuth gauge


Determining Which Way South Is

Solar south (or true south) differs from magnetic south depending on where on the planet you are.  For our collectors, we don’t care where magnetic north/south are, we care about how the sun tracks across the sky and where true south is in relation to the sun.

BuildItSolar has a list of several methods for determining solar south.  One that is not listed is the “I’m in the middle of nowhere but I have a stick and 2 rocks” method.  To determine true south take a mostly straight stick/rod that is about 3 feet long and stick it in the ground vertically.

Determining East-West First Mark

Stick with first marker placed.

Where the stick’s shadow stops, place a marker such as a rock, quarter, or large washer on the ground.  Then sit back, enjoy the sun and wait… 20 to 30 minutes should be fine.  After some period of time has elapsed, place a second marker on the ground where the stick’s shadow now is.

Determining East-West Second Mark
Stick with second marker placed.

With the two markers now on the ground, draw a line between the markers.  This line will run east – west.  A line drawn perpendicular to the east/west line will give you north/south.

Determining East-West Both Marks
Direction of true south determined.


Tools For The Survey

As mention above, you’ll need to obtain a sun chart and an elevation/azimuth gauge.

A sun chart shows the position of the sun (elevation and azimuth) for every minute of the day.  Sun charts are available from the University of Oregon here.  You just need to enter your zip code (or your latitude/longitude), download the pdf file, and print it out. 

The elevation/azimuth gauge can be downloaded from here courtesy of BuildItSolar.  You’ll need to print out 2 copies.  One will be used to make the azimuth gauge, the other will make the elevation gauge.

Once they are printed out, make the azimuth gauge first.  To do this, attach the print out to a piece of cardboard (I used some adhesive spray), and then attach a small wooden pointer to it with a nail through the center point of the reference circle.  Then take the gauge and place it on a flat surface and align it so that it is pointing south.  When you’re done it should look something like this:

Azimuth Gauge
Azimuth Gauge

The elevation gauge will also need to be attached to a piece of cardboard.  Once that is done, trim the paper and cardboard along the “site line” that is marked on the paper.  Next you’ll attach a piece of string with a small weight attached to the end (like a washer) to a nail that is pushed through the center of the reference circle.  When you’re done it should look something like this:

2012-02-13_13-11-21_80
Elevation Gauge


Conducting The Survey

To start the survey, make sure the south marking on the azimuth gauge is inline with solar south and then move the pointer on the azimuth gauge so that it is pointing east.  As you move the pointer from east around to the west, note the position of any obstacles such as trees, buildings, mountains, etc.  When you find an object, take the elevation gauge and site along the “site line” to the top of the object.  Note the angle that the string is at and place a pencil mark on your sun chart for the corresponding azimuth and elevation angles. After you’ve worked your way around to the west, you’ll need to draw a horizon line on your sun chart by connecting the dots.  When you’re done it will look something like this:

Shop South Wall Solar Site Survey
Site Survey Sun Chart Showing Obstructions


Comparing The Survey to Collector Data

From the survey sun chart you can see that I have a large obstruction due south (at the 180 degree mark) of my collector location.  I have another tree 40 degrees west of that, and by the time the sun is 60 degrees west of due south, it’s behind the tree line and done for the day as far as generating useable heat.  If we look at the line for Jan 21 and where it intersects with the horizon line, I should start getting sun on the collectors from 9am – Noon, from 1pm – 3pm, and a little between 3pm – 4pm.  When we compare this to the graph of the temperatures from the collector we see that the data matches up pretty close.  The collector starts warming up a little after 9am and runs until roughly noon.  It then comes on again about 1:30pm and stays on until 3pm. 

2012-01-12
Temperature Graph From Solar Collector

One nice thing about the site survey is that you can look at the sun chart and determine how long certain objects will affect the collector performance.  The sun chart shows that starting in mid-Feb, the sun will clear the top of the large tree to the south of the collectors and that the collectors will get full sun from 8am - 2:30pm and from 3pm – 4pm. 

Monday, February 6, 2012

Solar Air Heater #2

I recently completed the build of a screen based solar air heater that is now attached to my shop next to the soda can based solar air heater that I built last year and detailed here.  It is based on designs from BuildItSolar and the Yahoo Simply Solar group. 

2012-02-06_14-20-17_746

Screen and Soda Can Heaters


Construction

  • Frame:
    • Constructed from ¾" x 4 ⅝" oak. This size was selected to match the finished depth of the can based collector that it is mounted next to.
    • Outside dimensions of the box are 96" x 49"
    • The back of the box is a piece of ¼" plywood.
    • The outside of the box was painted with exterior latex paint that matches the paint on the building.
    • There is a cap on top of the collector box that is sloped to shed water.
    • There are trim strips on the sides to close off the gaps between the box and the siding so that the local wasp population can't build nests behind the collector.
  • Insulation
    • The back and sides are insulated with ½" R3 polyisocyanurate. ½" is the thickest any of the local home centers in this area carry.
  • Screen:
    • Two layers of 18 x 16 x 0.011 mesh aluminum insect screen spaced 1 ¼" apart and painted black with high temp grill paint.
    • The screen is mounted on a ¾" wide by 1 ¼" deep frame that fits just inside the insulated sides of the box.
    • The wood for the screen frame was not perfectly straight and required that a horizontal spreader be placed across the screen frame at the mid-point to keep the frame from bowing in.
    • The spreader is ¾" x ¾" and will block some of the vertical flow of air that is between the 2 layers of screen. This might possibly force some of the air back through the screen. Is this good or bad? After completion I realized I could have used a much smaller spreader, maybe 3/8 dowel.
    • The screen is mounted parallel with the glazing. It is not tipped outwards from the bottom to the top as some collectors I have seen.
    • The screen frame is held up off of the back insulation with 4 small wood blocks that are sized to center the screen in the box between the back insulation and the glazing.
  • Glazing
    • The glazing is 2 pieces of Suntuf from Home Depot.
    • There is a vertical support bar in the center of the box where the 2 pieces of glazing overlap. At first I tried just sealing the 2 pieces together with silicone but this failed to hold up while moving of the glazing panels prior to installing them and I realized it wouldn't hold up during expansion/contraction of the glazing panels either. The glazing is now screwed to the support bar to hold the 2 pieces together. There is a bead of silicone run between the 2 pieces to help with sealing.
    • The glazing is currently not sealed to the collector frame. It is screwed to the frame at every valley location on the wiggle strips. It is also screwed to the stiles of the collector box about every 15 inches.  This was done so that the glazing could easily be removed if I decide to add a third layer of screen.
  • Fan and Ducting:
    • The air inlet and outlet ports are 4" round duct. They are centered in the box horizontally and are offset from the top and bottom by 2".
    • The fan is a 125 cfm fan. General guidelines from the Yahoo Simply Solar email group suggests 3 cfm per sqft of collector.
    • This is the same model fan used in the soda can based collector.
    • The fan is mounted at the lower duct location and pushes air through the collector instead of being mounted at the top and pulling air through the collector.
    • The temperature control is provided by a 90/110 snap switch. It is mounted to the back right next to the outlet port.


Thoughts After Construction

  • Twin-wall polycarbonate looks much better.  However, 
    • The 2 pieces of Suntuf cost $42.
    • The closest place I can get twin-wall is 100 miles round trip and is $90 for a 4' x 12' sheet. 15 mpg in the truck and $3.15 for gas adds another $21 to the twin-wall price.
  • I was surprised that with 2 layers of screen how easy it is to see the insulation on the back of the collector.  Based on Gary Reysa’s tests on BuildItSolar it appears that 2 layers of screen will absorb approximately 52% of the incoming light.  This collector has a reflective back so the screens will get a chance to absorb some light on its way back out for a total of about 80% absorption.  While the collector seems to be performing well, I’m not pleased with having possibly 20% of the light reflected back out of the collector.  I need to investigate adding a third layer of screen or painting the back of the collector black.

Saturday, January 14, 2012

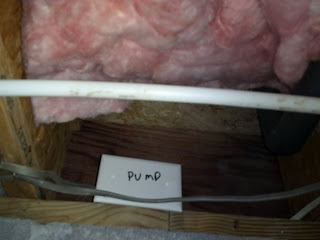
Crawlspace Insulation Fail

I recently did a full survey of all the insulation in my crawlspace. I've been under the house on several occasions before but I never really looked at the insulation other than to say "yep, there's some there."

I'm not really sure what inspectors look for before signing off on the different phases of construction, but I have a feeling that when it comes to insulation and crawlspaces, the inspectors just ask the contractor if they insulated the crawlspace and if the contractor says yes, then it passes inspection.

Armed with a flash light and camera I dove in to see what I would find.  Below are a few of the flaws/shortcuts that the contractor took. 


On the north side of the house, there is a just a partial floor joist bay between the band joist and the first floor joist.  Since this is an odd size the easiest thing to do is not install any insulation.


Whenever there are pipes in the way, obviously the best thing to do is to push all of the insulation to one side. 


When you encounter duct work, you must not install any insulation above it.  No one is ever gonna look up there anyway, right?  And when you do put a section of insulation in, you should grab a piece that's 16" wide even though the engineered joists are on 19.2" centers. 


When you get to the end of a roll and you're 12-14 inches short of making it to the end of the joist bay, it's probably good enough.   On the east side of the house, every single bay was short by about a foot.  Lovely...


On the left side of this picture the exterior wall makes a 45 degree turn and runs right into "it's Miller time".  The end result is a three foot gap.  Notice that the insulation isn't pushed up tight against the sub floor either.  This allows cold air to get another 6-8 feet further in before it finds an insulation hanger that is properly installed.

Friday, December 9, 2011

Changing The Thermostat - What Affect Does It Really Have?

The Home Monitor that I built has been collecting data for several months now and I decided to look back at some of the data that was collected on how often my heat pumps come on and which zones are calling for air the most.  In particular I was interested in knowing what affect different thermostat settings had on how often the heat pump came on.

To do this I looked at a single zone on the upstairs heat pump that controls the temperature for the two guest bedrooms.  During this past summer when the guest bedrooms were not in use the thermostat was set to 80 degrees.  When we did have a guest using one of the bedrooms, the thermostat was set to 76.  The rest of the house is set to 76.

I then went through the data for the summer and collected information on 6 days where the outside temperature and attic temperature were roughly the same.   On half of those days the guest bedrooms were not occupied and the thermostat was set at 80.  On the other half the bedrooms were occupied and the thermostat was lowered to 76.

Below are the graphs for the attic and outside temperatures during those 6 days.  The data graphed in red is the attic temperatures, blue is the outside temperature.

Daily temps with guest rooms unoccupied.


Daily temps with guest rooms occupied.


The data for the guest bedroom zone was then graphed (shown below) when the thermostat was set to 80 degrees.  Average run time for the three days was 123 minutes per day.  Note that the zone typically didn't call for cooling until late in the day when the outside and attic temperatures were near their maximum.

Thermostat set to 80

The data for the guest bedroom zone was then graphed (shown below) for days when the thermostat was set to 76.  Note that the zone calls for cooling throughout the entire day and that by the time the hottest part of the day arrived, the zone had already been calling for cooling for over 200 minutes.  Average run time for the 3 days was 560 minutes per day.


Thermostat set to 76


What did I learn from this?  There was a 78% reduction in the time that the zone is calling for cooling when the thermostat was set to 80 instead of 76.   Installing a programmable thermostat and actually programming it (instead of just pushing the "hold" button), can have a dramatic affect on the amount of time your hvac system runs.

Wednesday, September 21, 2011

End of Summer Update

This summer was a very good test of the changes I have made to reduce my energy usage.  Although it was hot, it wasn't quite as bad as last year.  The degree days show that it was well above average and slightly less than last year.    I did make a few changes in addition to the changes I made earlier in the year that were detailed here.

It is so humid here during the summer that it's very rare that we ever open the windows.  All of my windows are casement windows that have the bug screen on the inside.  So the first change was to remove all of the screens and store them away until early Fall when we start to open the windows again.  The reasoning behind this was all of the testing that's been done on solar air heaters using window screen as the absorber material.  If it's that good of an absorber, I need to just get it out of the way and let the shade reflect as much light and heat back out as it can.


The second change was to make better use of my programmable thermostats.  They have very specific schedules set to them now and in addition, the two guest rooms now have their dampers mostly closed on the days that no one is here using them.

The end result of this is some excellent news!  At least my wallet thinks so.   The total KWH usage for the months of June - Aug was down 4,255 kwh over last summer and the total bill for was down $365.  So far for the year I'm about 9,000 kwh under the usage of my six year average.


Thursday, September 15, 2011

Water Heater Analysis - Part 3

Hopefully the saga with the water heater is coming to an end soon as the thermosyphon loop that was detailed here has been fixed.  After several months of sporadic discussions with my hvac contractor (who has supposedly been in contact with Water Furnace) about how to fix the problem, how much it was going to cost to fix, and whether I should bear the cost of fixing it, I now have an electronic valve installed on the outlet side of the desuperheater.  The valve only opens when the desuperheater comes on and should completely stop the thermosyphon loop that was sucking heat out of my tank.

 It's supposed to cool off a lot tomorrow and I turned on the hot water heater for the first time since the end of June yesterday.  When the desuperheaters stop supplying all of my hot water this weekend, I'll be able to get some temperature readings from the tank to see if this new valve really fixed the problem.


Friday, July 1, 2011

A Home Built Heat Pump / Energy Usage Monitor

A couple of years ago I bought a small robot kit for my kid to experiment with from a company called Parallax.  Along with the robot I bought a couple extra of their Stamp chips just to play around with.  After a couple of months the "this is interesting" factor wore off and I moved on to something else.  Last summer (2010) after working in the attic one day I wondered how hot it got up there and thought about the possibility of putting a temperature sensor in the attic that I could monitor remotely.   Already having a BS2P from Parallax on hand, I connected a Dallas Semiconductor DS18B20 to it and wrote a small program to log the data to my PC every 15 minutes.   After a few days, I started wondering how the outside temperature affected the attic temperature and added some more code to log the outside temperature as well (a year worth of data is here at BuildItSolar).  I then added an additional sensor in the crawl space and not knowing where I was going with it, put the project on the back burner.

The Birth Of My Home Monitor

In Dec 2010 I ran across BuildItSolar and Gary's Half Program and I soon knew where I was going with those few temperature sensors.  The project needed to grow.  A lot.  After looking at a couple of options for chips/circuit boards to monitor multiple 1-wire temperature sensors, I decided to just keep on using the Parallax BS2P's since I had them on hand.  Personally, I've not used the Arduino yet, but from what I've read I'm sure it would be more than capable of doing what I've implemented. 

What I'm Monitoring

I now have 16 temperature sensors installed around the house with most of them monitoring what my two Water Furnace ground source heat pumps are doing.  Here's a run down of where the sensor are located:

UpstairsLogging Time
AtticEvery 15 minutes
OutsideEvery 15 minutes
HP Supply AirEvery 1 min when HP On
HP Return AirEvery 1 min when HP On
HP Desuperheater OutEvery 1 min when HP On
HP Desuperheater InEvery 1 min when HP On
HP Earth Loop OutEvery 1 min when HP On
HP Earth Loop InEvery 1 min when HP On

DownstairsLogging Time
Crawl SpaceEvery 15 minutes
Hot Water TankEvery 1 minute
HP Supply AirEvery 1 min when HP On
HP Return AirEvery 1 min when HP On
HP Desuperheater OutEvery 1 min when HP On
HP Desuperheater InEvery 1 min when HP On
HP Earth Loop OutEvery 1 min when HP On
HP Earth Loop InEvery 1 min when HP On

I also have 7 sensors that detect when the different zones for each heat pump come on.  The upstairs heat pump has 3 zones and the downstairs heat pump has 4 zones.  Detecting when the heat pumps are on allows me to log the heat pump temperature sensors only when they have meaningful data.

When I received and installed my TED 5000 in Jan 2011 I quickly found out that the load profiling software didn't work quite as well as I wanted it to.  To fix that problem I added the ability to retrieve all of the "seconds" data from the TED 5000 and save it to disk and I wrote my own functions to do the load profiling.  Since I have all the data locally now, I generate all the usage graphs within my monitor program and rarely look at the TED web console anymore.

I now have a fairly complete energy picture of my house and can see not only how much electricity is being used and what's using it but can also see how well things are working.  It also gives me the ability to log some baseline data so that when I do make changes I can actually see if it makes a difference.


Monday, June 27, 2011

A Flatlined Hot Water Tank

One of the projects that I've been considering implementing for the house is a water based solar space heater similar to the $2K System that Gary over at BuildItSolar installed.  The basic idea is simple, gather heat from the sun during the day, store that heat in a large water tank, and distribute that heat into the house when needed. One of the issues that needs to be resolved before I jump in and start construction is what to do with all that heat during the summer.   From what I've seen on BuildItSolar and on the SimplySolar yahoo group is that most people use these system for both space heating and as a pre-heater for their hot water.  I would like to use all of the heat during the winter for space heating, but during the summer when I could make hot water, I wasn't sure that I needed it.  I suspected that my ground-source heat pumps with their desuperheaters provided all (or nearly all) of my hot water during the summer.  If that's the case, then my ROI would be significantly lower as the system would only be used during the heating season and would be stagnant for all of the cooling season.

Testing the desuperheaters

To find out if the desuperheaters could handle the entire DHW load I ran a couple of tests.  The first one was simple... turn off the hot water heater at the breaker.   After a short prayer service, the switch was flipped and the hot water heater flatlined at noon on May 24.


The graph above shows that the hot water heater really has been off for the last month.  The tank temperature seemed to be ok as all of the showers continued to be hot.  But to be sure, the second part of the test was to install a temperature sensor on the hot water tank.   The sensor is a DS18B20 and is installed against the inside tank wall underneath the insulation near the upper thermostat.  The sensor readings were spot on with the temperature of the water that I was drawing out of the tank, so now it's just a matter of logging the data every minute and graphing it.


The manual that came with the Water Furnace heat pumps says that the desuperheater circuity kicks out at 130F so I should never see tank temperatures above that.  The 5 day graph above shows that the tank temperature slowly drops during the early morning when the heat pumps run infrequently, but the temperature recovers nicely during the day and if it gets above 90 for any length of time during the day, there's a good chance that I will max out the tank temperature.  The big dip during the day on the 26th was a shower immediately followed by a bath just to see what would happen.

What I've found from this is that my desuperheaters can provide all of my hot water during the summer months as long as some thought is given to when things happen.  So, that brings me back to my original problem.  If I build a water based solar collector, what do I do with it during the summer months?

Hmm...